
Wood supply
Interact and customise your visualisations and tables:
Each visualisation and table has a series of filters at the top. From these filters, you can customise the data you wish to visualise or include in your custom table. The data in the visualisation or table will change automatically as you select different groupings. To reset the information to its default, you can click on the “reset” icon in the tool bar found at the bottom of your visualization or table.

Download data:
- Click inside of the data table (to access the numeric data) or the comments section (to access the comments).
- Select the download icon from the tool bar found at the bottom of your visualization or table:

- Select one of the following options:
- Image: Downloads an image of the view in .png format.
- Data: Opens a new tab in the browser window and displays the view's data in summary and detail. You can then download the data as a comma-separated value (.csv) file.
- Crosstab: Downloads the view, or the selected sheet in a dashboard, as a .csv file you can open in Microsoft Excel.
- PDF: Downloads a PDF of the view, specific sheets from a dashboard, or specific sheets from a workbook. Under Include, select the part of the workbook you want to download. Select specific sheets or select all. Select Scaling to control the image's appearance on the PDF. Select Paper Size and Orientation.
If you're downloading a dashboard to PDF format, web page objects aren't included. - Tableau Workbook: Downloads a workbook you can open with Tableau Desktop or Tableau Reader. Tableau Reader can be downloaded here.
Share data:
Every published view and workbook can be shared via links in email and other applications, or embedded directly into web pages, wikis, and web applications.
- To share data, select the share icon from the tool bar found at the bottom of your visualization or table.

- Select one of the options for sharing:

View full screen:
Visualisations and tables can be viewed full screen. This option is helpful when viewing large datasets.
- To access the full downloadable data set, select the download icon from the tool bar found at the bottom of your visualization or table.

- To exit full screen mode, use the “Esc” (Escape) key.
*a Extensive = Current protection from fires and insects; forest renewal with natural regeneration only.
Basic = Extensive management plus artificial regeneration where necessary.
Intensive = Basic management plus stand improvement of juvenile stands plus acceleration of artificial regeneration.
In 2002, Allowable Annual Cut was renamed to Potential Harvest and in 2004, it has been renamed to Wood Supply.
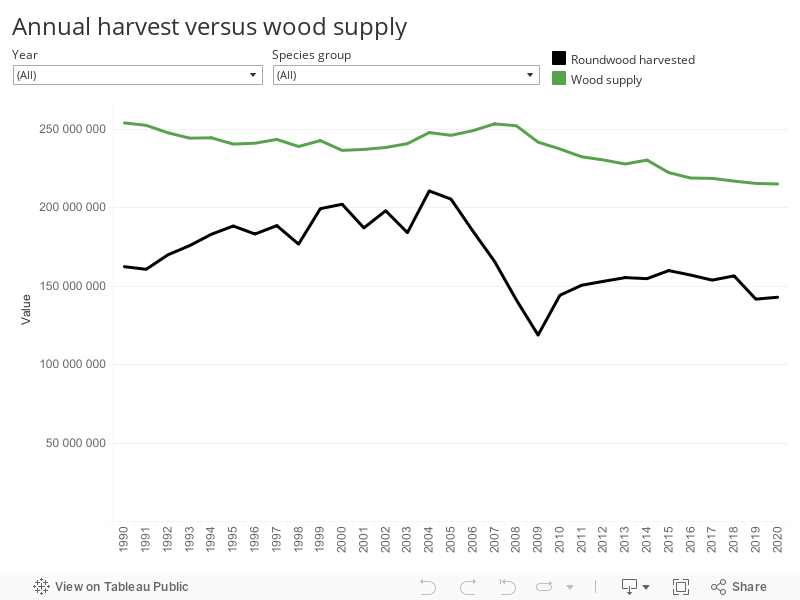
Wood supply of industrial roundwood as an indicator for potential sustainable harvest
The National Forestry Database (NFD) has been reporting on wood supply and harvest of industrial roundwood since the first edition of the Compendium of Canadian Forestry Statistics in 1991. Wood supply, as a proxy for potential sustainable harvest, refers to an allowable volume of timber that can be harvested over a specified period of time (or in some jurisdictions, an allocated area of forest where timber can be harvested). It is calculated as the sum of 1) estimated Annual Allowable Cuts (AACs, or other similar term1 ) for provincial Crown lands, and 2) estimates of wood supply on federal, territorial and private lands.
Guided by their own forestry policies, each province estimates their potential harvest levels or AACs on lands under their jurisdiction. These volumes of industrial roundwood (or areas) that may be potentially harvested each year from provincial Crown lands are established by professional foresters with the objective of maintaining sustainable wood supplies over long periods. In most jurisdictions, the AACs are established to reflect the unique social, environmental and economic characteristic of each forest management unit.
Canadian forests being largely publicly owned and managed (94%), the remaining wood supply from private lands is relatively small. Wood supply estimates from private lands are either based on sustainable management plans (when available) or on past harvest levels. Because these estimates are not standardized and not necessarily similar to the methods used to calculate the provincial AACs, variations in these estimates do not necessarily reflect changes in harvest sustainability but rather the various methods of calculating harvest levels.
Actual harvest of Industrial Roundwood
Wood supply refers solely to the potential volume of timber (harvested trees) delivered and transformed at mills for industrial roundwood2. Harvest refers to the actual volume of timber harvested. The harvest can be divided into two types: regulated and unregulated.
Regulated harvests apply to harvests from provincial Crown land (except in the case of private lands within tree farm and woodlot licences in British Columbia) and in the Northwest Territories3. Provincial law requires that the harvest levels be reported to ensure that they do not exceed the AAC, which are generally set over multi-year regulation periods varying from 5 to 10 years depending on the jurisdiction. While AACs cannot be exceeded over the set regulation periods, annual deviations of up to 50% are allowed. These fluctuations often reflect changing dynamics in specific areas (for example in the case of an insect outbreak in a forest management unit that requires a higher-than-expected rate of harvest). Additional information may be obtained from provincial resource management organizations.
Unregulated harvests refer to harvests occurring on federal, some territorial and private lands, although some of these lands may be managed to produce target harvest volumes. Because these harvests are not regulated by provincial laws, volumes are estimated by either provincial or federal forest authorities located in that jurisdiction. Some private land and woodlot owners are members of larger private woodland federations or unions and seek support for managing their wood supply and harvest.
National Forestry Database reporting for wood supply and harvest
While there is no AAC calculated for Canada as a whole, the NFD provides a national portrait by compiling jurisdictional data from provincial, federal, territorial, and private wood supply and actual harvest of industrial roundwood. Prior to 1990, wood supply from private and federal lands was typically not included. The historical data on wood supply and annual allowable cut before 1990, found below, are sourced from various earlier studies. Since 1990, the aggregate of AACs across all provinces and territories has been relatively constant and include estimates of wood supply for private lands and federal lands. In 2014, about two-thirds of this allowable cut was actually harvested.
| Year | Softwoods | Hardwoods | Total |
|---|---|---|---|
| 1957a | 127 | 55 | 182 |
| 1960a | 155 | 57 | 211 |
| 1968a | - | - | 240 |
| 1971a | 195.8 | 32.6 | 228.4 |
| 1976a | 176.9 | 39.6 | 216.5 |
| 1979a | 173.8 | 54.2 | 228.0 |
| 1983a | 166.7 | 40.4 | 207.1 |
| 1986a | 165.6 | 59.0 | 224.6 |
| 1988a | 174.7 | 59.0 | 233.0 |
| 1989a | 166.0 | 59.0 | 225.0 |
| 1990b | 187.7 | 61.9 | 249.6 |
|
aFigures represent the estimated AAC for "economically accessible" lands and exclude some private lands. bThe national AAC figures were arrived at by estimating some data for private and federal lands, and converting the Ontario area figures for 1990-1998 into volume figures. Sources: Runyon 1991 and Statistics Canada. |
|||
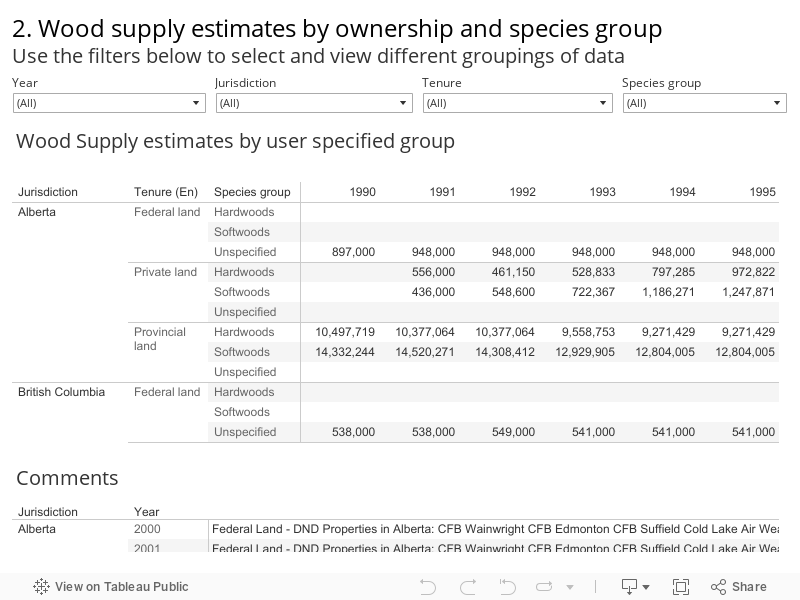
Tables 2.1 provide NFD users with current and historical detailed information on wood supply estimates by species group for public, private and federal lands.
In an effort to streamline the number of tables, the NFD has integrated information found in Table 2.2 (annual harvest and current annual AAC) into the provincial profiles. It is important to note that because harvest control is implemented on a periodic rather than an annual basis (which varies across jurisdictions), annual deviations of up to 50% are allowed as long as harvest does not exceed the set AAC over the regulatory period. Therefore, it is possible for jurisdictions to occasionally report more harvest in a given year than the actual AAC. The NFD has historically reported on the periodic AACs (formerly Table 2.3) but because regulation periods are not consistent across jurisdictions, in terms of either period length or starting and ending years, the utility of this indicator and of the statistics derived from it were deemed too limited. Its value lay in demonstrating that harvest in Canada does not exceed AACs over regulatory periods. Therefore, in lieu of Table 2.3, the NFD invites you to examine Canada’s annual harvest versus wood supply.
Table 2.4, titled “Wood Supply Projections, by Jurisdiction” is discontinued. The variation in provincial and territorial methodologies for projecting wood supply prevents the NFD from publishing national data. For more information on how jurisdictions project wood supply, we encourage users to direct their questions to provincial and territorial government contacts.